1/2 - Easily visualize data with our smart charts
Overview
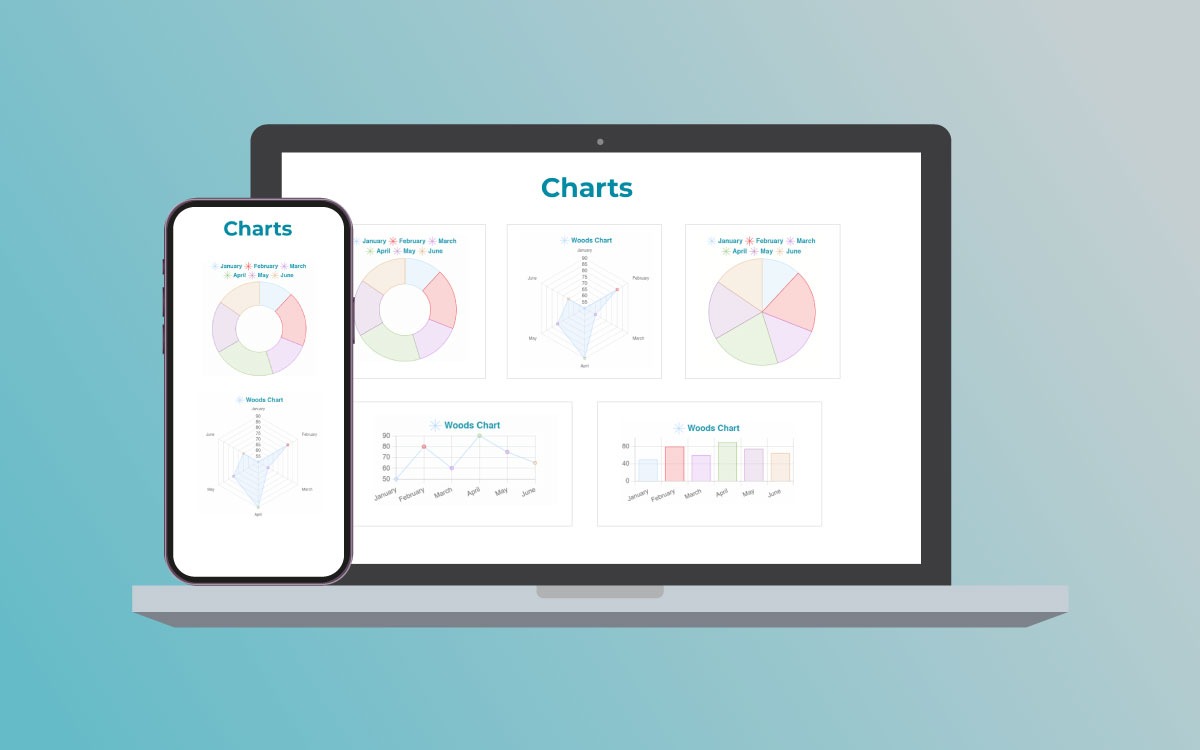
Turn your data into engaging stories with Chart module. Discover various dynamic chart options:
- Bar Charts: Compare data points precisely.
- Pie Charts: Get insights into proportions.
- Line Charts: Analyze trends clearly.
- Doughnut Charts: View data with a unique perspective.
- Radar Charts: Explore data in a distinct way.
Use the Chart module for easy and customizable charting. Make your content stand out and connect with your audience effortlessly. Chart Module is user-friendly, making data analysis both informative and visually appealing. Dive into the world of data storytelling and enhance your insights with simple and effective Chart Module.
Features
Multiple Chart options
Try out different charts easily with our tool. From bar charts for details to pie charts for insights, we've got various options to make your data stand out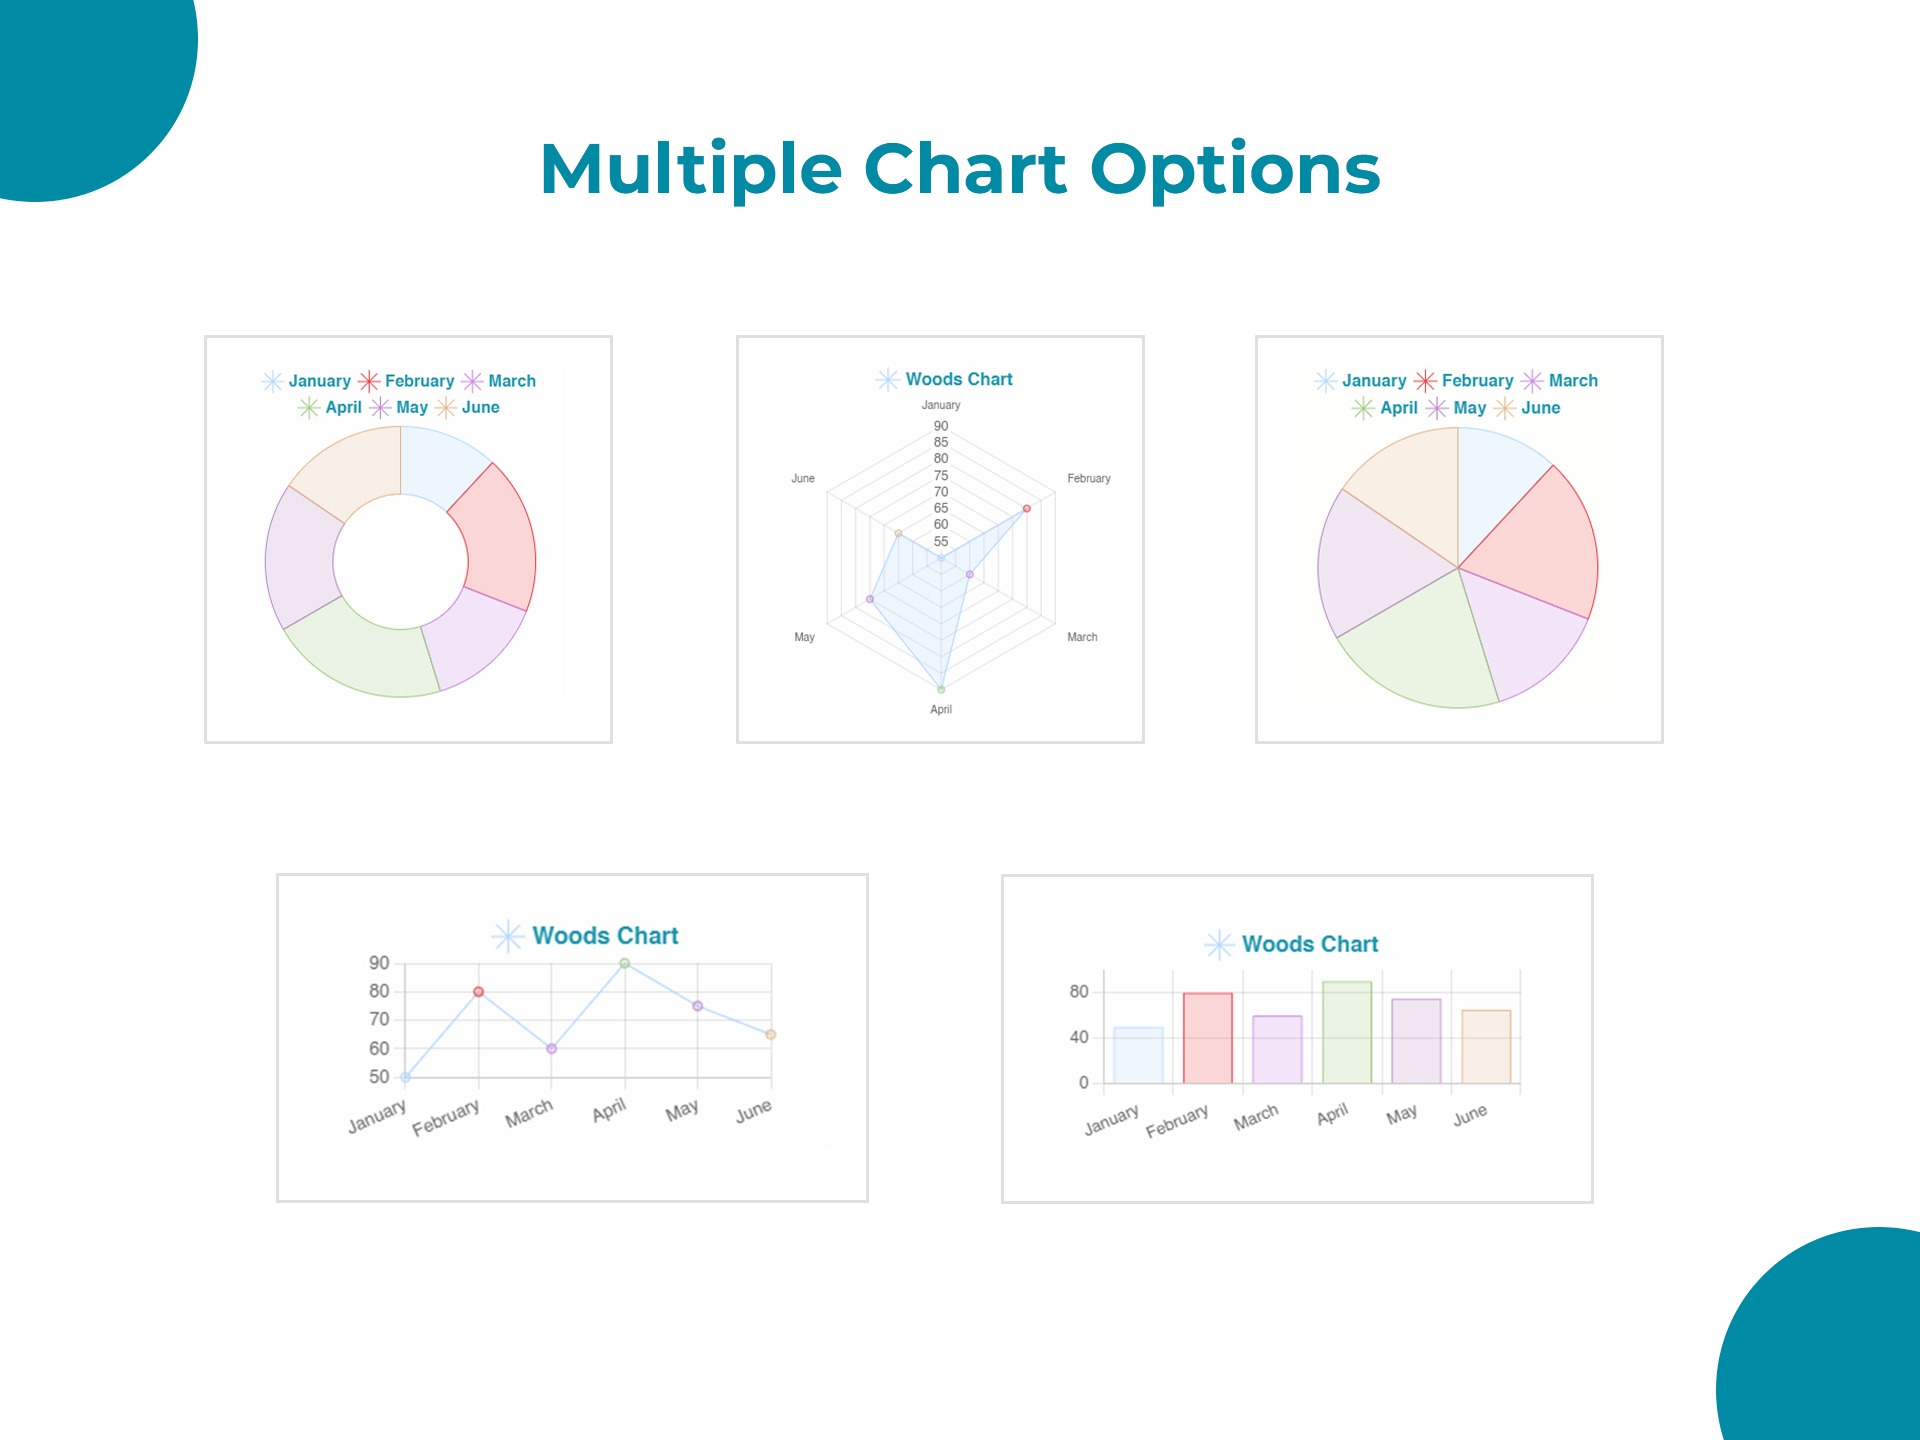
Unlimited customization Options
Unlock endless customization possibilities with our Chart Module. From colors to layouts, easily personalize your charts to fit your unique style and needs.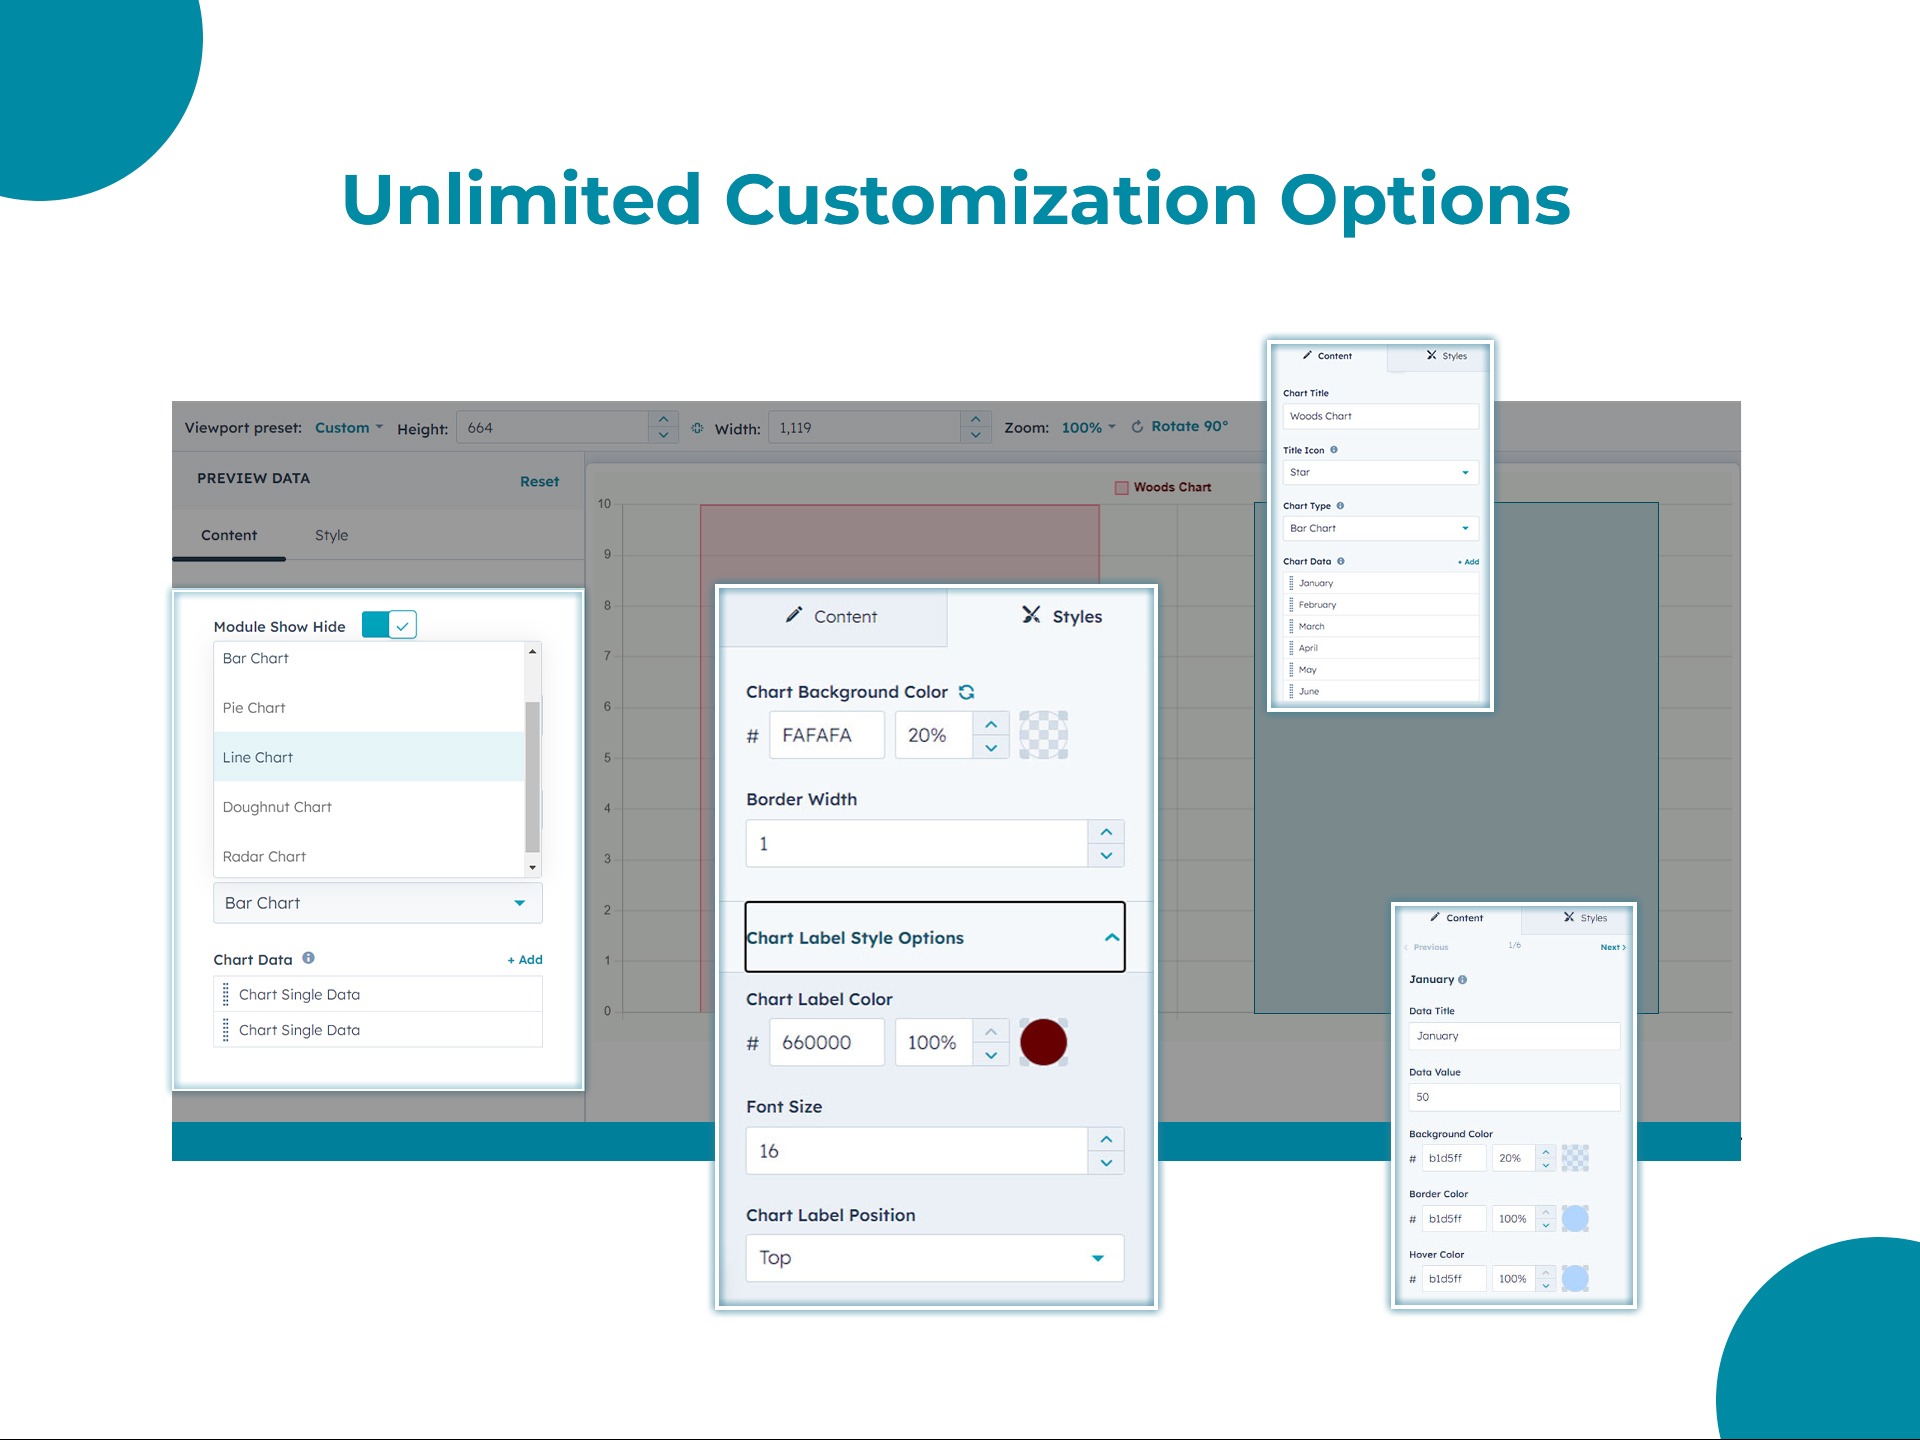
Responsive Design for all Devices
Seamless viewing on any device with our responsive design. Your charts look great, whether on a desktop, tablet, or mobile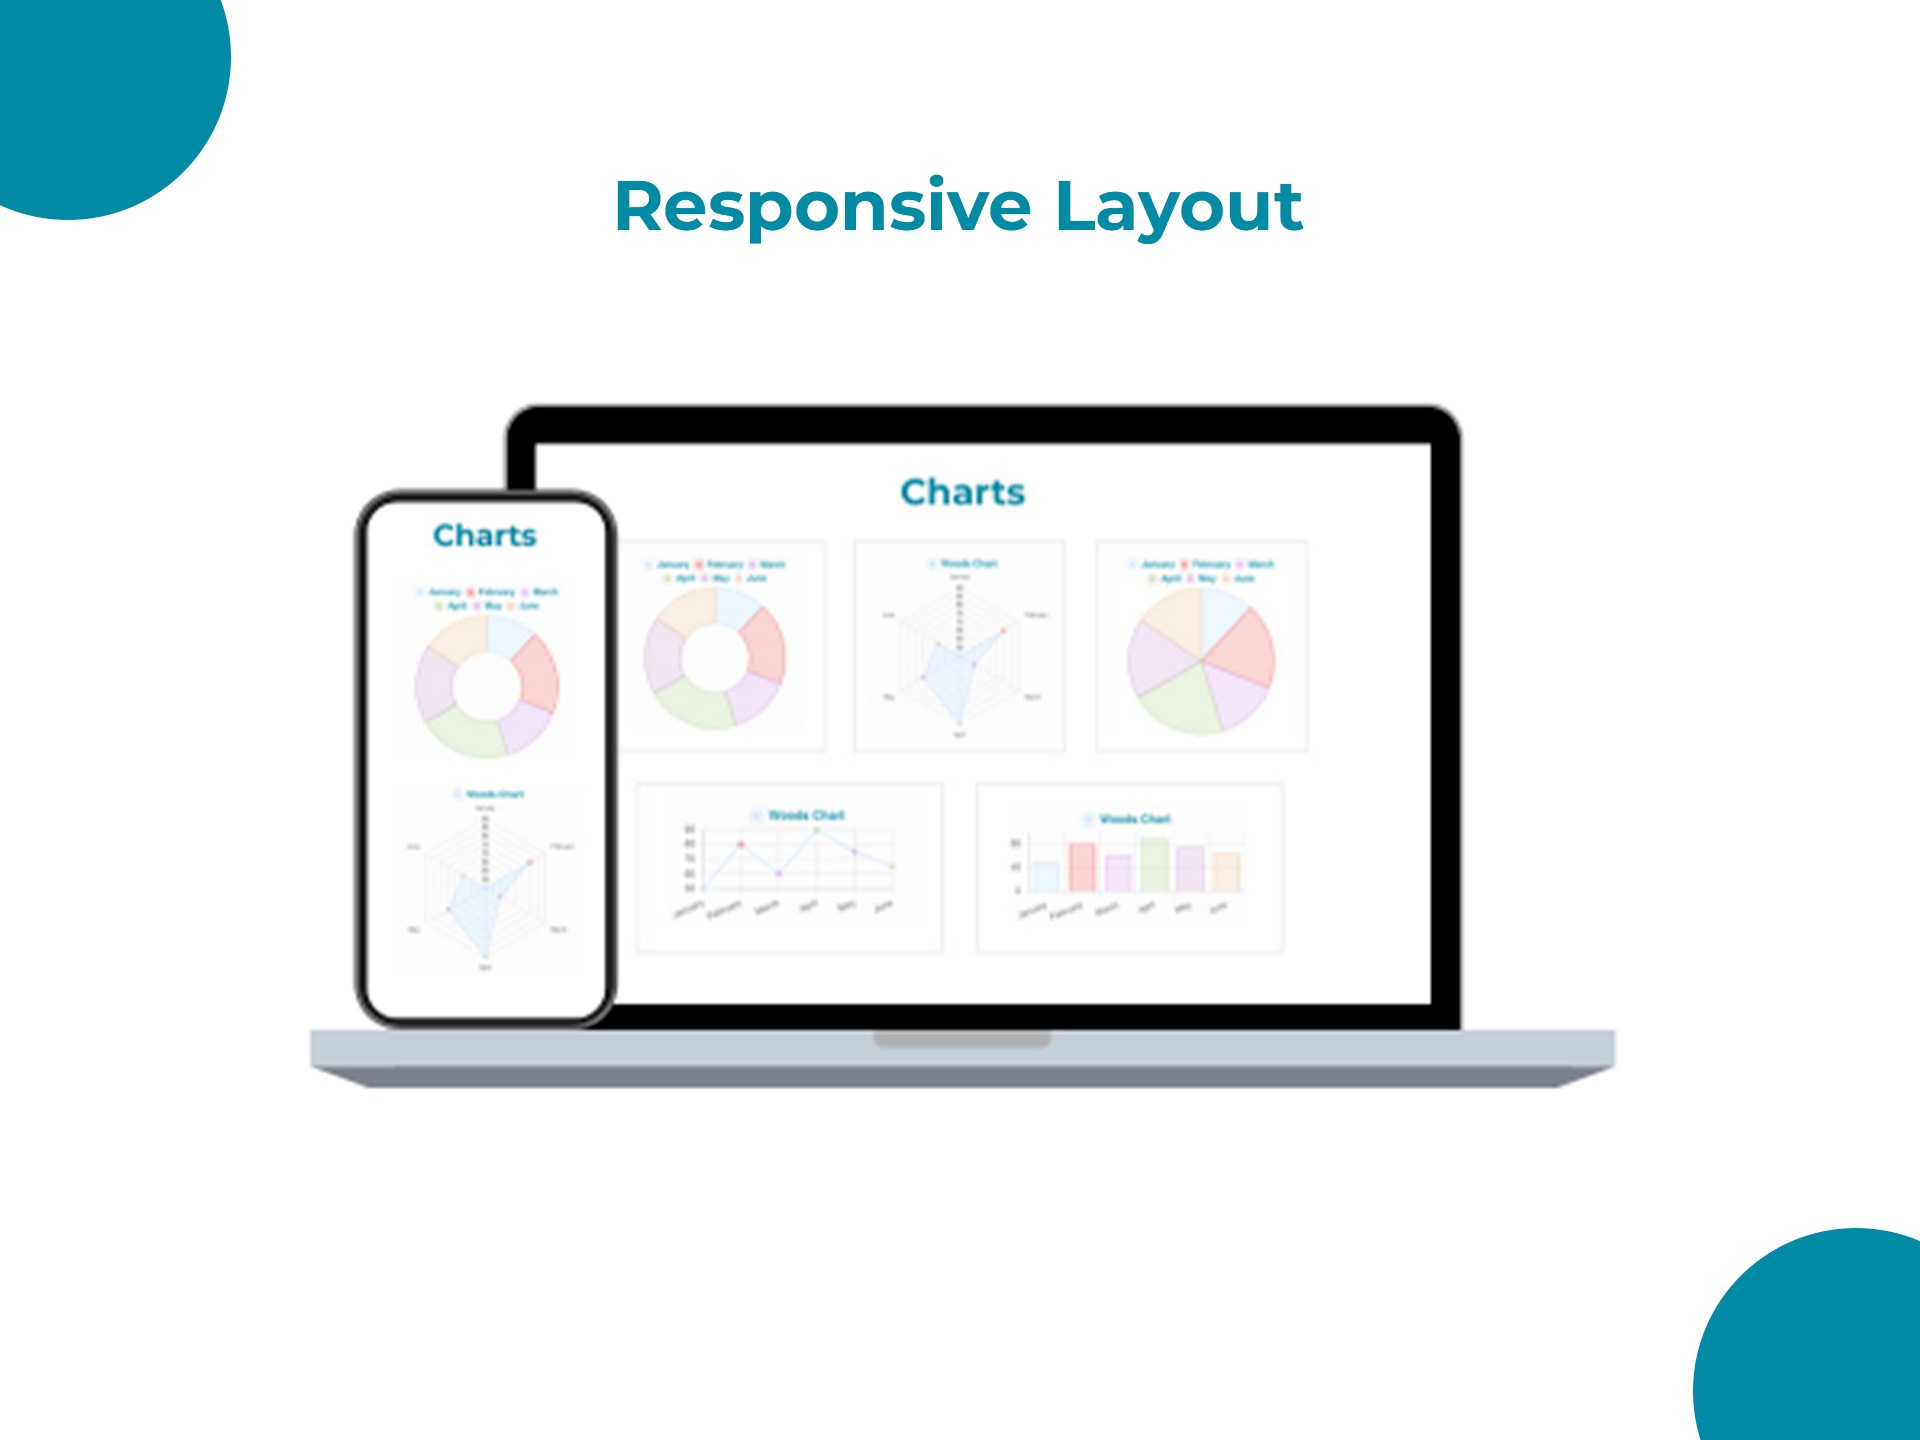
About Module
Total installs - 300+
Created - Nov 30, 2023
Version 2 - Oct 15, 2024
Categories Tags
Requirements
HubSpot Subscription Works with all HubSpot plans
Contact Digital Woods
Legal Stuff
Please refer to the developer's Privacy Policy and Terms for more information.
Support
Digital Woods
- United States
Visit website
We build deeply integrated apps and websites for scaling companies using HubSpot.
Unlimited support via email and chat
Module customization
Digital Woods typically responds in
- Monday
3:30 AM - 4:30 PM (EST) - Tuesday
3:30 AM - 4:30 PM (EST) - Wednesday
3:30 AM - 4:30 PM (EST) - Thursday
3:30 AM - 4:30 PM (EST) - Friday
3:30 AM - 4:30 PM (EST)
Chart Customer Reviews
- Apr 10, 2025
Easy to use, but needs adjustments for responsiveness
I had a good experience with this module, it covered our main needs. It was very easy to use and set-up. One thing that the module would benefit would be adjustments for the responsiveness part. For example the longer chart data title, on smaller spaces(on mobile) the titles can be cut and you can't read it. Another thing would be that the pie and doughnut charts take extra white space on top and bottom and there is no way to adjust it with css. A nice to have would have been for the chart animation to start white the viewer reaches the chart and not on the page load. Thank you very much! :)
It was easy to adjust the presented fields. I loved the color setting for hover.
Easy to use out of the box.
1. Depending on the size it is presented some parts of the titles can be cut. 2. If you have longer titles it's harder to view the chart. I added the titles separately and only used numbers to display different data.
MIHALACHI, V.
Version 2
- Mar 27, 2024
Lack of customisation options
Can't customise things like labels on the pie charts very easily. It works okay but could be better.
Not at all.
Dynamic charts
Lack of customisation
Martin, H.
Marketing Services - 1 employee
Version 1